Guide
Reading a diagram
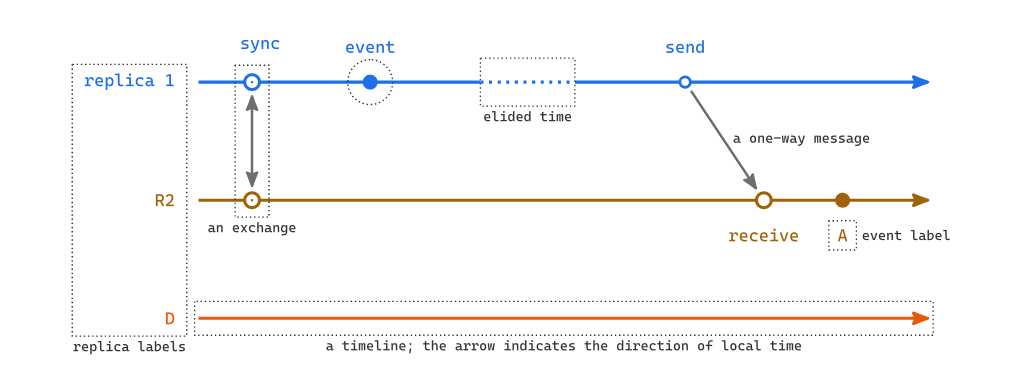
In following is table, each mark is accompany by some intended meaning; but authors might choose different semantics [1].
Mark |
Meaning |
|---|---|
Solid dot |
A local event, that happens at specific moment in the replica’s timeline. |
Hollow dot |
The replica receives events or messages from another replica. |
Small hollow dot |
A replica sends events or messages to another. |
Hollow dot with a dot inside it |
One end of a |
Dotted timeline |
Elided time and or local events. To convey hidden, not relevant events. |
Conventions of the placements
Time flows in the direction of the arrows of the timeline. A recv event is usually drawn a
centimeter further in the direction of time, so every message arrow follows the direction of time
without the diagram needing padding put in by hand.
Normally, labels are centred w.r.t their own mark and sit on the orientation’s default position. There are two exceptions:
The lane’s opening label on a horizontal diagram, which is nudged forward in time so it does sit next to the replica’s name.
The default position of
send,sync, andrecvis computed to be on the other side of the incoming/outgoing arrow. A lane’s ownlabel-positiondefault does not reach those three; every other lane default does.
Figures and cross-references
Attach the <label> after the call. With a caption the function returns a figure, so
the reference resolves to it and it numbers alongside the document’s other figures.
#lamport-diagram(
  caption: [`DeleteFile1` can be applied twice under concurrency],
  replicas: ("B", replica("A", below)),
  events: (
    "B": ([AddFile1], send("push"), [DeleteFile1], recv("pull", label-size: 0.8em)[now duplicated]),
    "A": (recv("push", mark-displacement: 0), [DeleteFile1], send("pull")),
  ),
) <fig-duplicated-delete>

As @fig-duplicated-delete shows, ...