A Typst Package for Lamport Diagrams
lamportian-dramatis is a Typst package to draw Lamport diagrams. You can easily draw lines for
each replica, local events as dots on that timeline, and arrows for the messages that carry events
from one replica to another. The timeline axis is logical time, in the sense of the clocks of
Time, Clocks, and the Ordering of Events in a Distributed System.
Pre-1.0. This is young and still changing a lot. Nothing here is a stable API until 1.0.0, so expect breaking changes between 0.x releases – argument names, defaults and the shape of what the helpers return are all still open. A Typst import names an exact version, so nothing breaks under you: upgrading is always a deliberate edit.
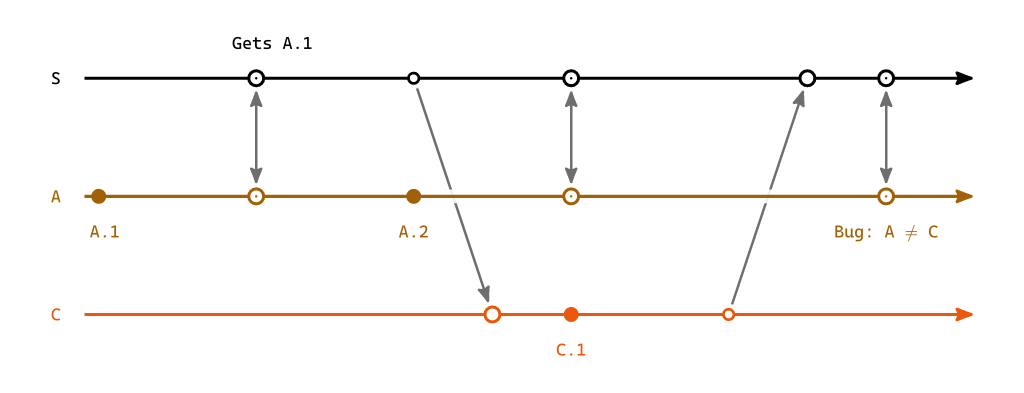
The image above is drawing with a DSL-like giving the replicas and their events:
#import "@preview/lamportian-dramatis:0.3.0": lamport-diagram, sync, below, above, send, recv, replica

#set page(width: 13cm, height: auto, margin: 0.4cm)
#set text(size: 10pt)

#lamport-diagram(
  replicas: (
    replica("S", above, color: luma(0)),
    replica("A", below),
    replica("C", below),
  ),
  events: (
    "S": (
      sync("boot")[Gets `A.1`],
      send("c-reads"),
      sync("a-pushes"),
      recv("c-pushes"),
      sync("a-catches-up"),
    ),
    "C": (
      recv("c-reads"),
      [`C.1`],
      send("c-pushes"),
    ),
    "A": (
      [`A.1`],
      sync("boot"),
      [`A.2`],
      sync("a-pushes"),
      sync("a-catches-up")[Bug: $A != C$],
    ),
  ),
)
Read on
Guide – how to read the marks, how the columns are solved, and how a diagram becomes a cross-referenced figure.
Reference – every function and every argument.
Overlays – drawing your own CeTZ into a diagram, addressing its own points, at a depth of your choosing.
Gallery – every example that ships with the package, each a complete document, with its source.
Changelog – what each release changed, and what is waiting unreleased.